A 1 kW rooftop solar system in India generates about 4 units (kWh) a day on average across the year — roughly 120 units a month and 1,300–1,600 units a year, depending on where you live, how the panels face and whether anything shades them.
That single number drives almost every solar decision: how big a system you need, how much your bill will drop, and how quickly the system pays for itself. This guide explains where the “4 units” rule comes from, how to calculate generation for any system size, how it changes by region and season, what reduces it, and how to check whether your own system is performing as it should.
Key points
- Rule of thumb: 1 kW ≈ 4 units a day ≈ 120 units a month ≈ 1,400–1,500 units a year on a well-designed, unshaded Indian rooftop.
- Formula: daily units = system size (kW) × peak sun hours × performance ratio (usually around 0.75–0.80).
- Sunny western and southern states generate more per kW than cloudier eastern and north-eastern regions; spring is the best season and the monsoon the weakest.
- Shading, orientation, heat, dust and equipment losses can cut generation well below the rule of thumb — a site-specific design gives the real figure.
The short answer
| Period | Typical generation from 1 kW |
|---|---|
| Per day (yearly average) | About 3.5–4.5 units, commonly taken as 4 |
| Per month | About 110–140 units, commonly taken as 120 |
| Per year | About 1,300–1,600 units |
These figures assume a grid-connected system facing roughly south at a sensible tilt, with no significant shade and regular cleaning. Your actual generation can be higher or lower; the rest of this guide explains why.
How solar generation is calculated
Generation depends on three things: the size of the system, how much sunlight reaches it, and how much of that sunlight becomes usable electricity.
- System size (kWp) — the rated capacity of the panels, for example 3 kWp for six 545 W panels (rounded).
- Peak sun hours — the daily solar energy at your site expressed as hours of full-strength sunlight. Much of India receives around 4.5–6 peak sun hours a day on average, depending on region and season.
- Performance ratio (PR) — the share of that energy that reaches your home as AC power after losses from heat, dust, wiring, inverter and mismatch. Well-designed rooftop systems are commonly around 0.75–0.80.
Daily units = kWp × peak sun hours × PR. For example, 1 kWp × 5.2 hours × 0.77 ≈ 4.0 units a day. That is where the familiar “4 units per kW” rule comes from.
“Four units per kW is a good starting point. Your roof decides the real number.”
Generation by system size
Using the 4-units-a-day rule, here is what common system sizes produce. Treat these as planning figures, not guarantees:
| System size | Per day | Per month | Per year |
|---|---|---|---|
| 1 kW | ~4 units | ~120 units | ~1,460 units |
| 2 kW | ~8 units | ~240 units | ~2,920 units |
| 3 kW | ~12 units | ~360 units | ~4,380 units |
| 5 kW | ~20 units | ~600 units | ~7,300 units |
| 10 kW | ~40 units | ~1,200 units | ~14,600 units |
To size a system the other way round — from your bill to the kW you need — see how many solar panels you need, or use the free solar size calculator.
Generation by region
India is sunny almost everywhere, but not equally. Sunlight is strongest in the dry west and north-west and in much of the south, and weaker where the monsoon is long and cloud cover is heavy. The ranges below are indicative for well-designed, unshaded rooftop systems, to show the pattern rather than promise a figure:
| Region (examples) | Indicative units per kW per year |
|---|---|
| West and north-west (Rajasthan, Gujarat) | ~1,500–1,700 |
| Central and south (Maharashtra, MP, Telangana, Karnataka, Andhra Pradesh, Tamil Nadu) | ~1,400–1,600 |
| North (Delhi NCR, Punjab, Haryana, Uttar Pradesh) | ~1,350–1,500 |
| East (West Bengal, Odisha, Bihar) and Kerala | ~1,250–1,450 |
| North-East | ~1,100–1,300 |
Within any region, local factors — haze, pollution, altitude and, above all, shading — can move a site above or below these ranges. A design that uses the site's actual location and obstacles is always more reliable than a regional average.
How generation changes through the year
Daily generation is not constant. In most of India it follows a clear seasonal pattern:
| Season | Typical generation | Why |
|---|---|---|
| Spring (Feb–Apr) | Highest | Clear skies, long days, panels not yet at peak summer heat |
| Summer (May–Jun) | High | Strong sun, but heat and dust reduce efficiency |
| Monsoon (Jul–Sep) | Lowest | Cloud cover and rain; varies a lot by region |
| Post-monsoon (Oct–Nov) | Good | Clearer skies, cooler panels |
| Winter (Dec–Jan) | Moderate | Shorter days, lower sun; fog and haze in the north |
This is why it's best to judge a system on its yearly total, and why net metering — which banks surplus from sunny months against weaker ones — matters so much. See net metering explained.
What reduces generation
- Shading — the biggest avoidable loss. A tank, parapet or neighbouring wall can cut output far more than its shadow suggests, especially in winter. See how shading cuts solar output.
- Orientation and tilt — panels facing south at a suitable tilt produce the most; east, west or very flat arrays produce less per panel. See our guide to the best tilt angle and direction.
- Heat — panels lose some efficiency as they get hotter, which matters on Indian summer afternoons. Airflow under a raised structure helps.
- Dust and dirt — a dusty array can lose a noticeable share of output until it is cleaned; see the maintenance checklist.
- Equipment losses — inverter conversion, cable resistance and panel mismatch each take a small share.
- Degradation — panels lose a little output each year; see degradation explained.
Capacity utilisation factor (CUF)
Engineers often describe generation as a capacity utilisation factor: the yearly units divided by what the system would produce running at full power all year. CUF = yearly units ÷ (kW × 8,760 hours). A 1 kW system producing 1,460 units a year has a CUF of about 16.7%. Rooftop systems in India commonly fall somewhere in the mid-to-high teens; a quoted CUF far above that deserves a closer look at the assumptions.
How to check your own system
- Open your inverter app and note the total units for the last full month.
- Divide by the system size in kW and by the number of days in that month.
- Compare with the season: around 4 units per kW per day is typical across a year, higher in spring and lower in the monsoon.
- Compare with the same month last year, after cleaning, rather than with a single number.
- If output is well below expectations on clear days, check for new shade, dirt or inverter errors, and call your installer.
“Judge a solar system by its yearly total. One cloudy week says nothing; one weak year says a lot.”
Getting a real figure for a real roof
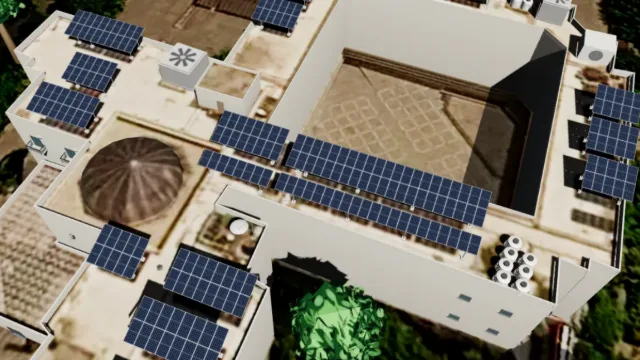
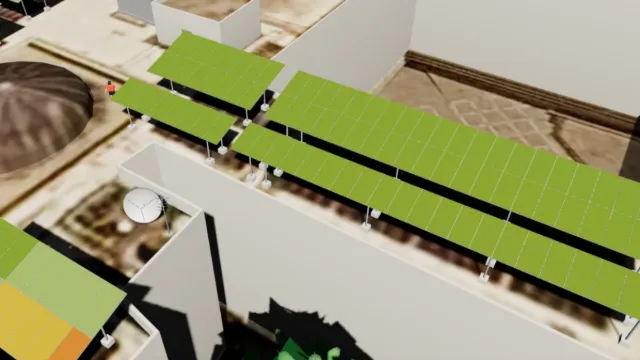
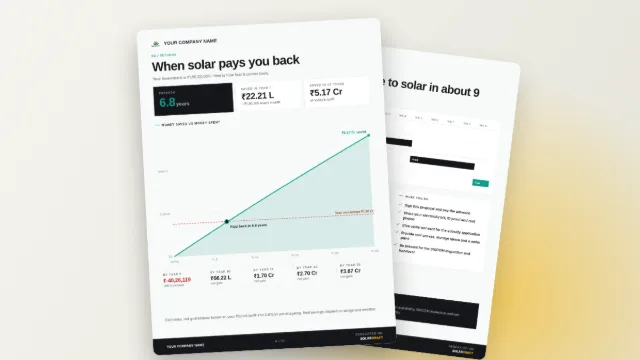
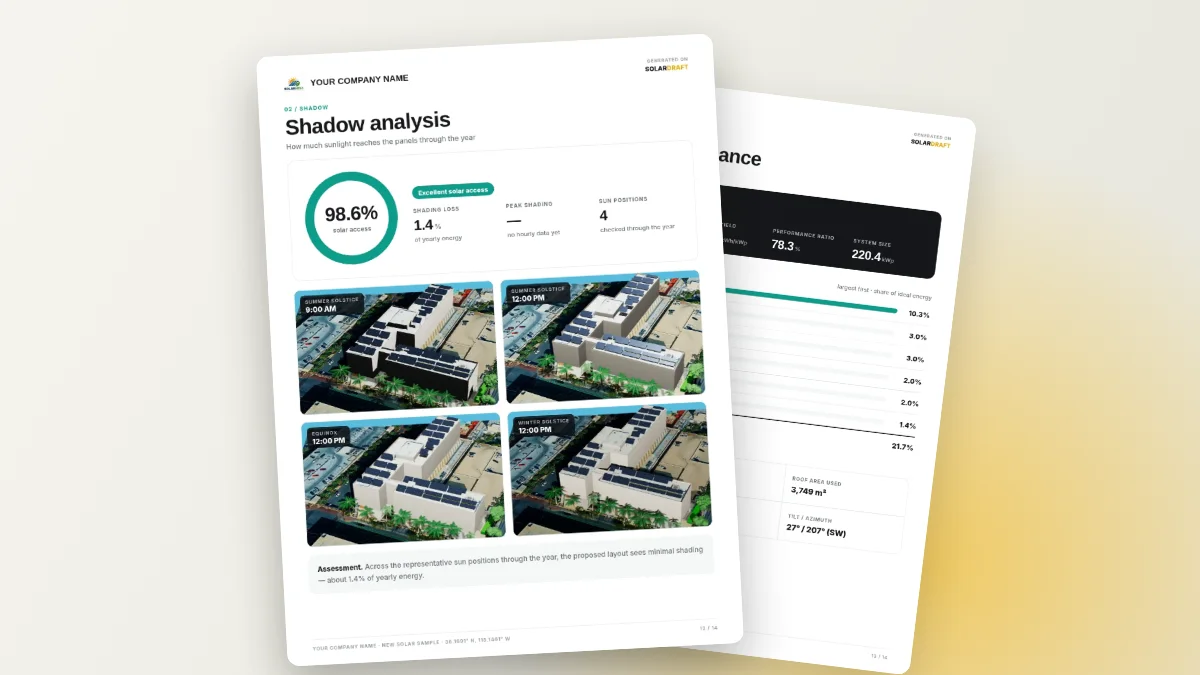
The rule of thumb is useful for a first conversation, but proposals should use generation calculated for the actual site: its location, the direction and tilt of every panel, and the shade from every obstacle. SolarDraft's Solar 3D Design models the real roof and runs a year-round shading analysis, and the Solar Proposal shows month-by-month generation from that design. Generation then flows into savings and payback, so getting it right protects every other number in the proposal.
FAQ
Does a 1 kW solar system generate 5 units a day?
On clear spring days in sunny regions it can, but averaged across the whole year most Indian rooftops produce closer to 4 units per kW per day.
How many units does a 3 kW system generate per month?
About 360 units a month on average (3 kW × 4 units × 30 days), more in spring and less in the monsoon.
Why does my system produce less in the monsoon?
Cloud cover and rain reduce the sunlight reaching the panels. It's normal, and net metering balances it against sunnier months.
Is 4 units per kW per day guaranteed?
No. It's a planning average. Actual generation depends on location, weather, orientation, shading and maintenance, which is why a site-specific design matters.