Every solar panel loses a small amount of output every year. This is normal, predictable and already priced into every honest proposal.
Degradation is one of the most misunderstood parts of solar. Customers hear “panels lose efficiency” and imagine a system that stops working after a few years. In reality, a good panel declines slowly and predictably, and manufacturers guarantee that curve in writing. This guide explains what the curve looks like, what causes it, what speeds it up in Indian conditions, how to tell degradation apart from other losses, and how to account for it in a proposal.
Key points
- Typical mono PERC panels lose about 2% in the first year, then around 0.5% a year, ending near 83–85% of rated output at year 25.
- Newer TOPCon and heterojunction panels usually carry better warranties, often with 30-year performance guarantees.
- Main causes: light-induced degradation, potential-induced degradation, thermal cycling, micro-cracks and material ageing.
- Not every drop is degradation — dust, new shade, inverter faults and weather explain most sudden changes.
What the curve looks like
- A small first-year dip (~2% for many mono PERC panels), then a steady ~0.5% per year after.
- Panels from reputable manufacturers degrade more slowly than budget alternatives.
- Heat, humidity and poor installation quality can accelerate it.
| Year | Typical guaranteed output (mono PERC) |
|---|---|
| 1 | 98% |
| 10 | ~93–94% |
| 20 | ~87–88% |
| 25 | ~83–85% |
Newer technologies such as TOPCon and heterojunction (HJT) panels usually carry better warranties — often around 1% in the first year and roughly 0.4% a year after, with 30-year performance guarantees. Always check the exact figures on the datasheet of the panel you're quoting.
“A panel at year 20 still produces close to 90% of its day-one output — degradation isn't decay, it's a slow taper.”
What causes degradation
| Cause | What happens | When it matters |
|---|---|---|
| Light-induced degradation (LID) | A one-time drop in the first weeks of sunlight | Year one; explains the larger first-year dip |
| Potential-induced degradation (PID) | Voltage stress between cells and frame, worse with heat and humidity | Hot, humid sites; long strings |
| Thermal cycling | Daily heating and cooling stresses solder joints and cells | Every year, especially in hot climates |
| Micro-cracks | Tiny cracks from rough handling or walking on panels; can grow | Starts at installation; shows up over years |
| Material ageing | UV slowly yellows encapsulants and back sheets on lower-quality panels | Later years; depends on material quality |
Linear vs step warranties
Performance warranties come in two shapes. A linear warranty guarantees a specific output for every year — for example, a first-year figure and then a fixed small drop each year. A step warranty, more common on older or budget panels, guarantees only a couple of checkpoints, such as 90% at 10 years and 80% at 25. Linear warranties protect the customer better because any faster-than-promised decline can be claimed in any year, not just at the checkpoints. Our warranty guide explains how claims work.
What degradation means in units
Here is an illustrative example for a 3 kW system producing about 4,350 units in its first year (roughly 1,450 units per kW), with output declining about 0.5% a year:
| Year | Approx. generation |
|---|---|
| 1 | ~4,350 units |
| 10 | ~4,150 units |
| 20 | ~3,940 units |
| 25 | ~3,830 units |
| 25-year total | ~1 lakh units |
Actual figures depend on location, design, shading and the panel's own warranty curve. The point is that a 25-year total of around 94% of “no degradation” generation is a small, predictable adjustment — not a reason to doubt solar.
Degradation vs other output losses
Not every drop in generation is degradation. A system can produce less because of dust, new shading from a growing tree or a neighbour's extra floor, a faulty inverter, or simply a cloudier year. Heat also reduces output on the day — panels produce less when they're very hot — but that's a temporary effect, not permanent ageing.
| Symptom | Likely cause |
|---|---|
| Slow, steady decline over years | Normal degradation |
| Gradual drop over weeks, recovers after cleaning | Dust or soiling |
| Sudden drop in one string | Fault, loose connector, or new shading |
| Lower output on hot afternoons | Temperature effect (temporary) |
| Lower output all season | Weather: haze, cloud, a long monsoon |
Before blaming the panels, check the basics in our maintenance checklist and look for new shading.
How to slow it down
- Choose panels from reputable manufacturers with clear, linear warranty terms — see panel types compared.
- Handle panels carefully during transport and installation; never walk on them.
- Use a well-designed structure that allows airflow under the panels.
- Keep panels clean and check connectors and earthing every year.
How to check your own system
Degradation is slow enough that you won't see it month to month. The fair test is to compare the same month across years, after the panels have been cleaned, and allow for weather: a hazy winter or a long monsoon will lower generation without anything being wrong. If output falls well below the warranty curve, ask your EPC to test the panels. The inverter app's yearly totals are the most useful record to keep.
“Keep the yearly totals. They are the evidence for any warranty claim you might ever need.”
Building degradation into proposals
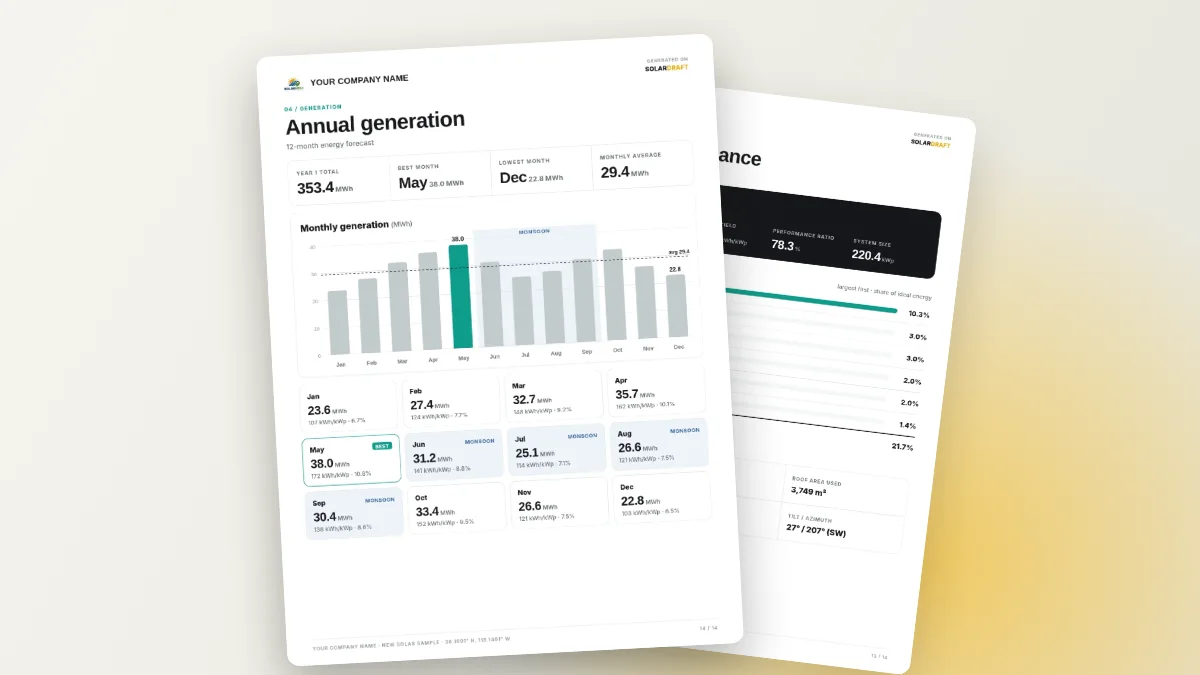
An honest proposal shows year-by-year generation with degradation applied, not the same number repeated for 25 years. That keeps payback and lifetime savings realistic and avoids complaints later. SolarDraft proposals include annual and 25-year generation built from the 3D design — you can see the annual generation page in the sample proposal. Customers can run their own numbers with the free solar ROI calculator.
FAQ
Is 0.5% a year a lot?
No. Over 25 years it adds up to roughly 15% in total, and the payback period usually falls within the first several years.
What happens if my panels degrade faster than the warranty?
That's what the performance warranty covers. Read what a solar panel warranty actually covers and keep your invoices and generation records.
How long will the panels last overall?
Usually well beyond 25 years at reduced output. See how long solar panels actually last.
Do TOPCon panels degrade less than PERC?
Their warranties usually promise a smaller first-year drop and slower yearly decline. Compare the actual datasheet figures for the models you are considering.