Payback period is the single number most customers actually care about. Here's how to calculate it honestly — and how to check someone else's figure.
Payback tells a homeowner or business owner how many years of savings it takes to recover what they paid for the system. Everything after that is profit. The calculation is simple, but small shortcuts — ignoring shading, using the wrong tariff, forgetting degradation — can make a proposal look better than reality. This guide walks through the formula, a worked example, how sensitive the result is to each input, lifetime savings and return on investment, and how to present payback in a proposal.
Key points
- Payback = net cost (price minus subsidy) ÷ annual savings (units generated × the tariff you actually pay).
- A 3 kW home system in India often pays back in roughly 3.5–5 years, then keeps saving for 20 years or more.
- Tariff, generation (location and shading) and the subsidy move the result most; degradation and running costs adjust it.
- Lifetime savings and simple return on investment show the full value better than payback alone.
The basic formula
- Net cost = system cost minus subsidy (see PM Surya Ghar).
- Annual savings = units generated × your tariff rate.
- Payback = net cost ÷ annual savings.
A worked example
Here's an illustrative 3 kW residential system. Your real figures will depend on local prices, your tariff and your roof.
| Item | Example value |
|---|---|
| System price (incl. GST) | ₹1,80,000 |
| PM Surya Ghar subsidy | −₹78,000 |
| Net cost | ₹1,02,000 |
| Generation (3 kW × ~4 units/day × 365) | ~4,380 units a year |
| Tariff saved | ₹7 per unit |
| Annual savings | ~₹30,660 |
| Payback | ~3.3 years |
With a lower tariff, a smaller subsidy or a partly shaded roof, the same system could take four or five years. That's why the inputs matter more than the formula.
“A 3kW residential system in India typically pays back in 3.5–5 years, then saves for 20+ more.”
How sensitive is the result?
Using the same example, here is how payback changes when one input changes and everything else stays the same:
| Change | Annual savings | Payback |
|---|---|---|
| Tariff ₹5 per unit | ~₹21,900 | ~4.7 years |
| Tariff ₹6 per unit | ~₹26,280 | ~3.9 years |
| Tariff ₹8 per unit | ~₹35,040 | ~2.9 years |
| Generation 3.5 units/kW/day (shade or cloudier region) | ~₹26,800 | ~3.8 years |
| Generation 4.5 units/kW/day (sunny, unshaded) | ~₹34,500 | ~3.0 years |
| No subsidy (net cost ₹1,80,000) | ~₹30,660 | ~5.9 years |
The tariff and the subsidy have the biggest effect, followed by generation. That's why a proposal should use the customer's real tariff and a generation figure from a design of their real roof.
What moves the number
- Tariff — many DISCOMs use slab tariffs, so solar first removes your most expensive units. Use the rate you actually pay at the top of your bill, not the lowest slab.
- Generation — depends on location, orientation and shading. A generic “4 units per kW” can be too high for a shaded roof; see how much 1 kW really generates.
- Self-use vs export — units you use directly save the full tariff; exported units are credited under your state's net-metering rules.
- Degradation — output falls slowly each year; see degradation explained.
- Tariff increases — electricity prices tend to rise over time, which shortens real payback; conservative proposals ignore this or use a small rate.
- Running costs — cleaning, an annual check and one inverter replacement over the system's life.
| System | Typical payback |
|---|---|
| 3 kW | ~4 years |
| 5 kW | ~4.5 years |
Larger home systems often take a little longer because the subsidy is capped at 3 kW. Commercial systems don't get the residential subsidy, but higher tariffs and daytime usage often make their payback attractive too — see commercial vs residential solar.
Beyond payback: lifetime savings and ROI
Payback is easy to understand, but it isn't the only measure. Lifetime savings show the full value. In the example above, with output declining about 0.5% a year, the system produces roughly 1 lakh units over 25 years. At ₹7 a unit, that is around ₹7 lakh of electricity — several times the ₹1,02,000 net cost, even before any tariff increases and after allowing for an inverter replacement and routine cleaning.
| Measure | What it tells you | In the example |
|---|---|---|
| Payback period | Years to recover the net cost | ~3.3 years |
| Simple annual return | Annual savings ÷ net cost | ~30% a year |
| 25-year savings | Total value of the electricity generated | ~₹7 lakh before tariff increases |
Businesses may also look at internal rate of return and tax benefits. Customers who are financing the system should compare the monthly EMI with their monthly savings — see solar financing options.

Common payback mistakes
- Using the lowest tariff slab instead of the rate the customer actually pays on their last units.
- Assuming full generation on a shaded roof.
- Showing the subsidy as a discount on day one instead of a credit after commissioning.
- Ignoring degradation and running costs in long-term savings.
- Over-sizing for export and counting every exported unit at the full tariff.
Showing payback in a proposal
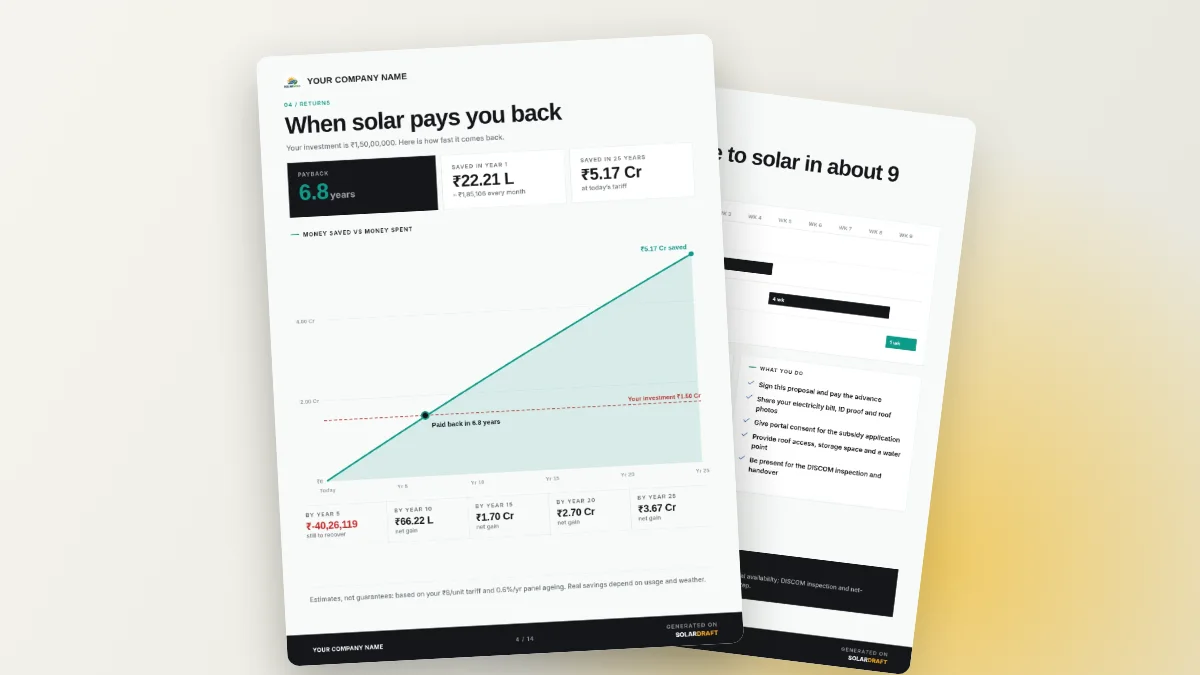
Put payback, annual savings and long-term savings on the first pages, and make sure they come from the actual design. SolarDraft's Solar Proposal includes a project ROI page built from the 3D design — see it in the sample proposal PDF. Customers can also check the numbers themselves with the free solar ROI calculator.
“An honest payback figure closes more deals than an impressive one, because it survives the customer's own maths.”
Payback estimates only hold if the system is sized correctly — see how many panels you actually need and factor in long-term degradation.
FAQ
Is a 3-year payback realistic?
It can be, with a good tariff, full subsidy and an unshaded roof. Four to five years is a safer expectation for many homes.
What if I export most of my solar power?
Under one-for-one net metering, credited units offset your imports. But surplus left at the end of the settlement year may be worth little, so oversizing beyond your consumption usually lengthens payback.
How do I check an installer's payback figure?
Ask for the generation estimate, the tariff used and the net cost behind it, then recalculate with the formula above. If the generation looks high for your roof, ask whether shading was analysed.
Does a battery change the payback?
Usually it lengthens it, because a battery adds cost without adding much saving on a net-metered connection. Calculate the panels and the battery separately.